Parsing One Billion Rows in Zig: 15x Performance Improvement
Recently, I came across the 1 Billion Row Challenge, and felt intrigued by the relatively simple challenge and the huge amount of opportunity for optimization and learning. The challenge is simple: given 1 billion rows of city names and temperatures in the following format:
|
|
return every cities minimum, maximum and average temperature, sorted in the cities alphabetical order. The algorithmic simplicity masks the true challenge: to write a program that can do this operation efficiently. Even a simple algorithm scaled to a billion rows presents its own challenges. This post documents my journey in improving my solution, going from a naive solution that took two and a half minutes, down to a very optimized 10 seconds, a 15x boost in performance.
I chose Zig for this challenge. Zig’s characteristics—no hidden control flow or memory allocation, are exactly what I need for this project. It forces me to think about these concepts, and manually wire everything together. For the purposes of this challenge, I am also going to stick to only using one thread, both to keep things simple, and to ensure I am maximizing efficiency rather than throwing more resources at the problem.
Iteration 1: Naive implementation Link to heading
With the language chosen, I began by writing a simple naive implementation:
Once I built and tested the code on some provided unit tests, I was ready to run and benchmark the full 1 billion row file (14.8 gigabytes in size). I got the following result:
45.87s user, 21.68s system, 42% CPU, 2:37.11 total.
Let’s examine the code to figure out what I did and why the time is so slow:
Iteration 1: Naive Zig Implementation
|
|
The flow of the program is very simple. Open the file, read its contents into a byte array with an allocator, and parse it. The parser splits this giant byte array by “\n” and each subarray by “;”. I then use the city as a key to a hashmap, where the value is a struct, containing min, max, sum and count. At the end I get all the keys, sort them, and print their corresponding values.
Examining the time, the program spends the vast majority of its time waiting on the disk to open the file, so much so that the CPU is only actually doing something for 45 seconds out of the 2.5 minutes. This is very inefficient.
Iteration 2: Memory mapping Link to heading
One way to reduce the system time here would be to use a concept in operating systems called memory mapping.
In a conventional file read, the OS fetches chunks from the disk into memory, but they first have to go into the kernel space, and only then copied to user space.
In contrast, memory mapping (mmap) works by virtually mapping the disk address space of the file you want to read into main memory. Reading a byte from a page not in memory triggers a page fault and the OS goes to the disk (as opposed to a swap file in a regular demand paging page fault) to fetch it. This avoids that “copy” between the kernel and user space in a normal file read.
Adding the following code:
Iteration 2: Memory Mapping
|
|
Yields us enormous performance gains:
43.51s user, 2.79s system, 75% CPU, 1:01.57 total
This is exactly what should happen. User time virtually unchanged while system time (how much the program waits on system calls) dropped by ~90%. Wonderful.
Iteration 3: Manual parsing Link to heading
Now that the bottleneck is firmly in the algorithm area, I needed more specific tools to measure my program. This is where a profiler comes in very handy. I selected samply which is a polling profiler with a minimal performance penalty. Running the profiler on a smaller test file produced the following result:
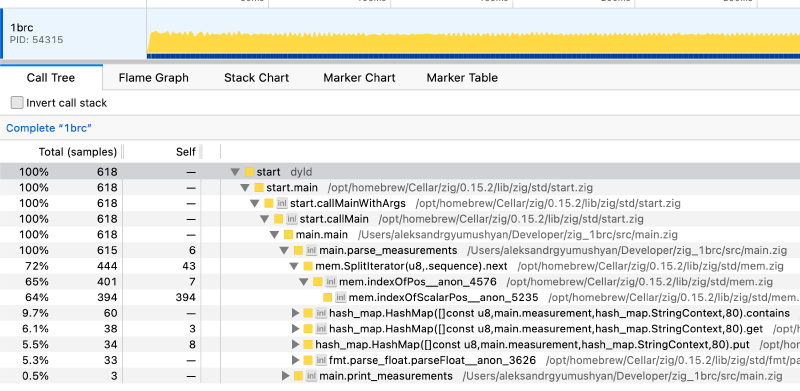
std.mem.splitIterator is a massive bottleneck, taking up ~70% of the entire execution time. Additionally, hash map operations take up about 12% and parse_float takes up another 7%. The rest is insignificant in comparison. Clearly, the areas to focus on are to 1. speed up logic to find the delimiters and 2. reduce hash map accesses 3. fix float parsing.
To fix the delimiter bottleneck: keep a start and curr index. iterate over every byte individually, and check when curr hits a delimiter. I then know if arr[start..curr] is either a city or a temp.
I can completely eliminate parse_float. By default, this func has to check for many edge cases which I know will never be hit. Every temp in the dataset is between -99.9 and 99.9. I can speed things up significantly by manually accumulating every additional digit into a temporary integer, and then dividing by 10 to get the true float temperature.
Lastly, I am needlessly making two calls to the hashmap, one to check if an item exists, and another to fill/update it. Zig has a built-in function called getOrPut() which eliminates this double hash. The new code looks something like this:
Iteration 3: Manual Parsing & getOrPut
|
|
These efforts produce an amazing jump in performance:
16.50s user, 2.74s system, 56% CPU, 33.910 total
In fact, this is such a large jump in CPU efficiency that despite user time dropping by ~3x, CPU utilization went down significantly.
Iteration 4: Custom Hash map Link to heading
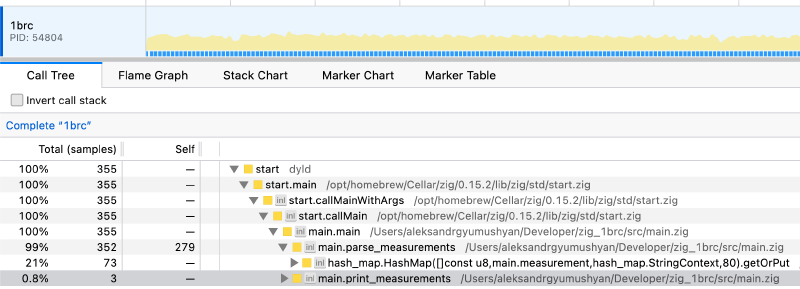
Looking at the call tree again, the program is still spending 20% of its time doing hashmap operations. From a first principles point of view, as per challenge requirements, I have roughly ~10k unique cities, each being about 8 to 16 bytes long. Even if they are longer, it doesn’t matter, the first 8 bytes are enough to determine uniqueness for the vast majority of them and the next 8 bytes will ensure total uniqueness. With these requirements, I need to prioritize hash execution above all else while keeping collisions low.
My research narrowed me down to the following architecture: a sparse hash table (~65k entries should probably be enough for now), linear probing for collision resolution, and FNV-1 hash function. My intuition for these changes is as follows:
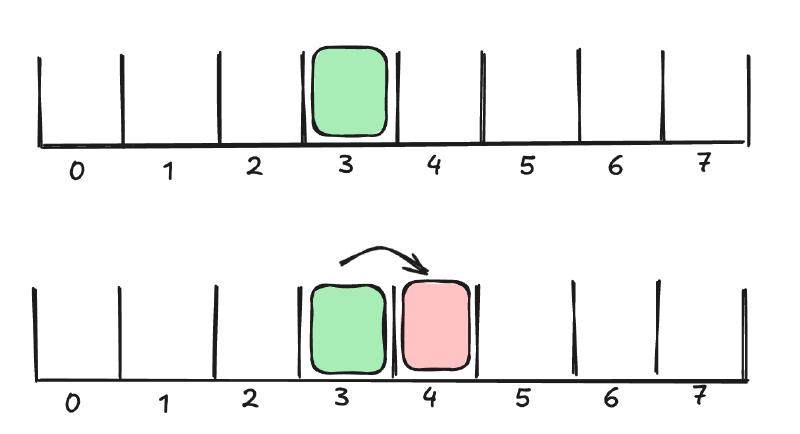
Linear probing is a technique for dealing with hash collisions. For example, if two different elements have an equal hash (3), then the second element will keep probing to the right until an empty slot is found (loop back to the front if end reached). By making significantly more slots than necessary (65k slots for ~10k unique cities) I am able to significantly reduce collisions. Additionally, by checking nearby elements, the algorithm exploits cache locality.
As for the hash function, FNV-1 stood out to me for its simplicity, the fact that it has to loop over every byte in the given input, which can very easily be combined with the current parser.
The new hash map:
Iteration 4: Custom Hash Map Implementation
1
2
3
4
5
6
7
8
9
10
11
12
13
14
15
16
17
18
19
20
21
22
23
24
25
26
27
28
29
30
31
32
33
34
35
36
37
38
39
40
41
42
const MAP_SIZE = 65536;
const MyHashmap = struct {
entries: []Entry,
allocator: std.mem.Allocator,
const Entry = struct {
key: []const u8 = "",
value: measurement = undefined,
hash: u64 = 0,
};
fn init(allocator: std.mem.Allocator) !MyHashmap {
const entries = try allocator.alloc(Entry, MAP_SIZE);
@memset(entries, .{ .key = "", .hash = 0 });
return .{ .entries = entries, .allocator = allocator };
}
fn deinit(self: *MyHashmap) void {
self.allocator.free(self.entries);
}
fn getOrPutWithHash(self: *MyHashmap, key: []const u8, h: u64) !struct { value_ptr: *measurement, found_existing: bool } {
var idx = h & (MAP_SIZE - 1);
while (true) {
const entry = &self.entries[idx];
if (entry.key.len == 0) {
entry.key = key;
entry.hash = h;
return .{ .value_ptr = &entry.value, .found_existing = false };
}
if (entry.hash == h and entry.key.len == key.len) {
if (std.mem.eql(u8, entry.key, key)) {
return .{ .value_ptr = &entry.value, .found_existing = true };
}
}
idx = (idx + 1) & (MAP_SIZE - 1);
}
}
};
New parser logic:
Iteration 4: New Parser Logic
 1
 2
 3
 4
 5
 6
 7
 8
 9
10
11
12
13
14
15
16
17
18
19
20
21
22
23
24
25
while (i < contents.len) {
    const start = i;
    var h: u64 = 0;

    // One-pass: scan for ';' and calculate hash
    while (contents[i] != ';') : (i += 1) {
        h = (h << 5) -% h +% contents[i];
    }
    const city = contents[start..i];
    i += 1; // skip ';'

    // Fast temperature parsing
    var temp: i32 = 0;
    var negative = false;
    if (contents[i] == '-') {
        negative = true;
        i += 1;
    }
    while (contents[i] != '\n') : (i += 1) {
        if (contents[i] == '.') continue;
        temp = temp * 10 + @as(i32, @intCast(contents[i] - '0'));
    }
    if (negative) temp = -temp;
    i += 1;
    // put the new temp into the hashmap with key = h
Implementing these changes, results in surprisingly small gains:
12.61s user, 2.74s system, 49% CPU, 30.958 total
User time is down significantly, as is CPU usage which means I am highly disk bound again.
Iteration 5: Manual buffering Link to heading
I decided to remove mmap entirely and go back to manual buffering, this time using the latest Zig reading interface and reading to a 8mb buffer. Mmap is a fundamentally reactive strategy where the OS fetches a page only when it needs to. This is great for databases with random reads and writes but not good enough to just go through one massive file once.
Iteration 5: Manual Buffering
|
|
The results after this change were very inconsistent. I often witnessed outright regression in performance, but sometimes getting very low times such as
12.16s user, 5.11s system, 79% CPU, 21.701 total
Experimenting with different buffer sizes and hash map sizes didn’t produce a meaningful difference. And the profiler couldn’t really tell me what was going wrong since it didn’t display system calls or what was happening in memory.
Iteration 6: Interleaved chunk reading Link to heading
My mistake dawned on me when I thought about the program from a higher level: I am reading the entire file into memory, and then parsing it. The OS is evicting most of the pages which I read in, unless the OS wants to keep the entire 15gb file that my program requests in memory, which is…unlikely, hence the inconsistency.
I fixed this problem by interleaving reading and parsing. The program reads as much as it can into a 1 megabyte sized buffer, and then parses it. Once it’s done with that chunk, it gets the next chunk. This way, the OS and disk are given some time to load the next chunk while the current chunk is parsed, minimizing waiting. The only downside is the additional logic of processing a chunk that doesn’t end on a newline delimiter.
I refactored main() and removed open_file() for simplicity:
Iteration 6: Interleaved Chunk Reading
|
|
The performance gains were immediately apparent:
11.84s user, 1.13s system, 98% CPU, 13.203 total
While user time didn’t go down that much, system time collapsed to about 1.1 seconds and CPU utilization shot up to 98% indicating that both the disk and the CPU were being used to the fullest. The only way to improve performance now is to dig into the algorithm and perform very specific optimizations.
Iteration 7: Removed branching 1 Link to heading
I was able to shave off some time by reducing branching (if statements) when parsing the temperature. CPUs don’t like branching as they execute instructinos out of order and branches make that tricky.
Iteration 7: Branchless Temperature Parsing
|
|
New time was:
11.29s user, 1.31s system, 98% CPU, 12.843 total
Not a meaningful increase, but still heading in the right direction.
Iteration 8: Removed branching 2 Link to heading
Keeping with the same theme, I removed the min and max if statements with built in @min and @max zig directives which also remove branching:
11.12s user 1.29s system 96% CPU 12.822 total
ALso didn’t produce any meaningful performance gain. Once again, the bottleneck continued to be in the parse_chuck function but it was difficult to benchmark and profile due to the fact that the profiler couldn’t tell me which line was doing what.
Iteration 8.1: Reduced runtime safety Link to heading
I was able to shave off half a second by adding the @setRuntimeSafety(false); for the parse_chunk flag:
10.97s user 1.29s system 98% CPU 12.443 total
Iteration 9: Faster semicolon detection + better hash function Link to heading
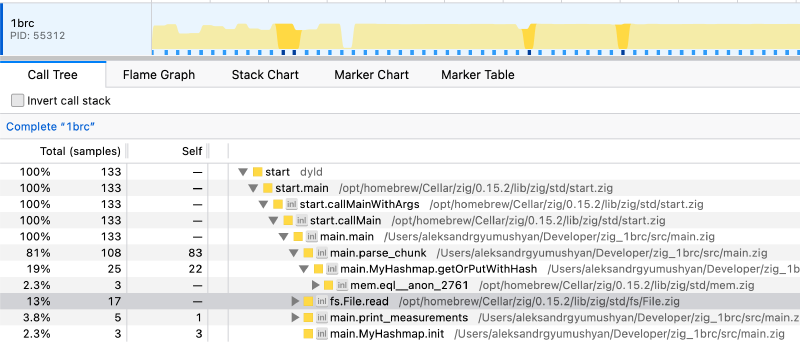
Now that all disk related bottlenecks are gone, let’s can re-examine the profiler:
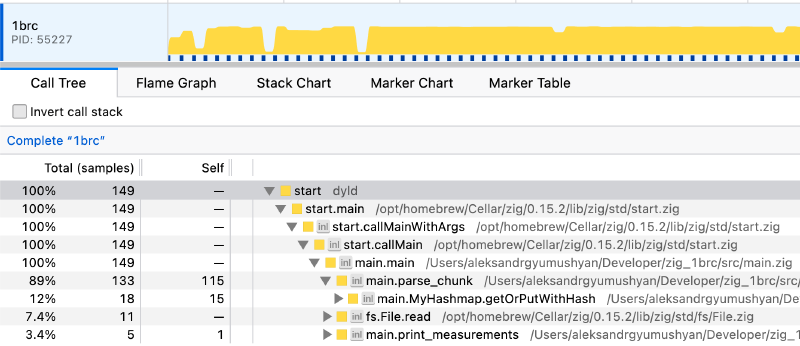
For the final push, I decided to tap into AI and redesign the hash function along with some parsing logic with the help of Claude Opus 4.5.
I was able to rewrite the city parsing logic to both find the “;” delimiter faster and hash the city in less instructions and in a more deterministic way. The better performance comes from grouping 8 bytes together into a 64 bit number, and using bitwise operations to find in which byte the delimiter is located. This is accomplished by XORing the 8 bytes with 0x3b3b3b3b3b3b3b3b (0x3b = “;”) and using the @ctz (count trailing zeroes) directive to get the index of where the delimiter is.
As for the hash function, I used Wyhash, which is the default hash used in Zig. Wyhash is based on the Wyhash project on GitHub. In this implementation, the custom hash logic is interleaved with the delimiter search to improve execution speed.
Iteration 9: Optimized Combined Hash/Scan Loop
|
|
Note how the hashing and parsing are tightly interleaved.
The end result is a ~15% reduction in user time:
9.34s user, 1.35s system, 98% CPU, 10.867 total
Final call stack:
Execution times:
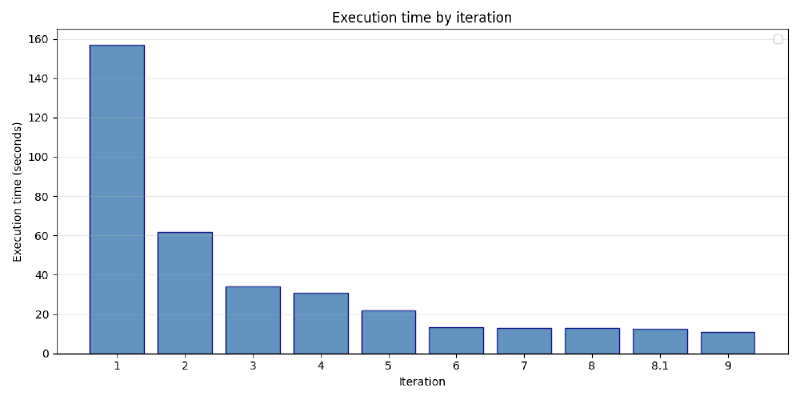
f I decided to stop here. I had a lot of fun making this program. It felt really good to finally pass all tests and then get a significant time reduction. With that being said, it was incredibly annoying to make iteration 9 work as debugging bitwise operations is a nightmare. Everything before that was frailty straightforward and in my view is more than enough for any task where performance is not the absolute highest priority.
Repository: https://github.com/AlexG28/zig_1brc
Cycle through the iterations via git log.
Future ideas: Link to heading
- Concurrency. This project was entirely single threaded. The fastest solutions to the 1brc are all highly concurrent.
- Highly efficient SIMD parsing. The trick in iteration 9 to use bitwise operations on multiple bytes at the same time is a very similar trick to SIMD. With very careful tuning, I am certain that more performance would be unlocked.
General thoughts on this project: Link to heading
- It is very important to understand operating systems, processes, and concurrency at a very deep level. In this case, understanding memory mapping, demand paging, and buffered reading better would have saved me a lot of time.
- Performance optimization gets very tricky once all the low hanging fruit have been collected.
- Zig is a fairly difficult language to get right. Writing correct Zig code is difficult. I need to try Rust and see how it compares.
- Bitwise operations are very hard to read/understand and extremely hard to debug.
- Polling profilers are amazing but not the whole story as it is difficult to tell what is the bottleneck inside a function. Samply was extremely easy to use.